The Public Brazilian Debt: Mechanics and Current Scenario
At a Glance
In April 2026, the Federative Republic of Brazil closed the largest international bond issuance in its history, raising EUR 5 billion across 4-, 7-, and 10-year maturities. Institutional demand exceeded EUR 16 billion (over three times oversubscribed), pricing a spread of 255 bps (2.55%) over the mid-swap rate for the 10-year maturity.
In parallel, geopolitical escalation in the Middle East triggered a global supply shock, pushing 2026 Brent crude forecasts to an average quotation of $91.25 (+25%). This event forced government intervention, mobilizing over R$ 30 billion in subsidies (diesel, LPG, aviation sector) and altering the interest rate trajectory; the market now prices a terminal Selic rate at 13.00% to mitigate an IPCA inflation index projected at 4.5%.
THE PARADOX — Why the State profits from global crises
The actual fiscal accounting of the State reveals a stark misalignment with the media narrative of the shock. This scenario represents a classic textbook case of how the budget works: surging commodities spark immediate domestic inflationary pressures and drive interest rates up, but simultaneously flood state coffers with extraordinary liquidity. Although the subsidies impose a primary cost of up to R$ 6.2 billion monthly, Brazil—as a net exporter—extracts a monthly revenue surplus (royalties, IRPJ corporate income tax, CSLL social contribution tax) estimated at R$ 8.5 billion. This compensatory anomaly has dragged the median estimate (Prisma Fiscal) for the 2026 primary deficit down to R$ 57.8 billion, compared to pre-crisis internal estimates of R$ 59.8 billion.
On the domestic front, liquidity to finance the State is guaranteed by retail savers. The Tesouro Direto (the outstanding stock of government bonds purchasable by citizens, standing at R$ 242.25 billion) evidences an absolute aversion to risk: 51.3% is invested in IPCA+ inflation-linked bonds, 36.7% in Selic floating-rate bonds, and only 12.1% in fixed-rate instruments. This micro-liquidity, characterized by 78.0% of investment tickets under R$ 5,000, injected net emissions of R$ 5.15 billion in April (gross sales of R$ 8.55 billion, buybacks of R$ 3.37 billion).
THE MECHANISM — The impact of high interest rates on corporate credit
The financial architecture operates on a fundamental balance-sheet dichotomy that protects sovereign risk while suffocating the real economy.
Cash flow and internal pressure are dictated by the Dívida Bruta (Gross General Government Debt, DBGG, anchored at 83.00% of GDP). To finance this colossal stock, the Treasury drains banking liquidity, triggering an aggressive spiazzamento (crowding-out). The floating debt consisting of LFTs (Letras Financeiras do Tesouro—floating-rate government bonds indexed directly to the Selic rate) amounts to R$ 4.16 trillion, or 47.7% of the total. With the current Selic at 14.50% and the CDI at 14.40% for July 2026—where the CDI (Certificado de Depósito Interbancário) represents the average overnight interbank lending rate that closely tracks the Selic—a mere 100 bps (1%) hike costs the State an additional R$ 41.6 billion annually in short-term interest expenses alone.
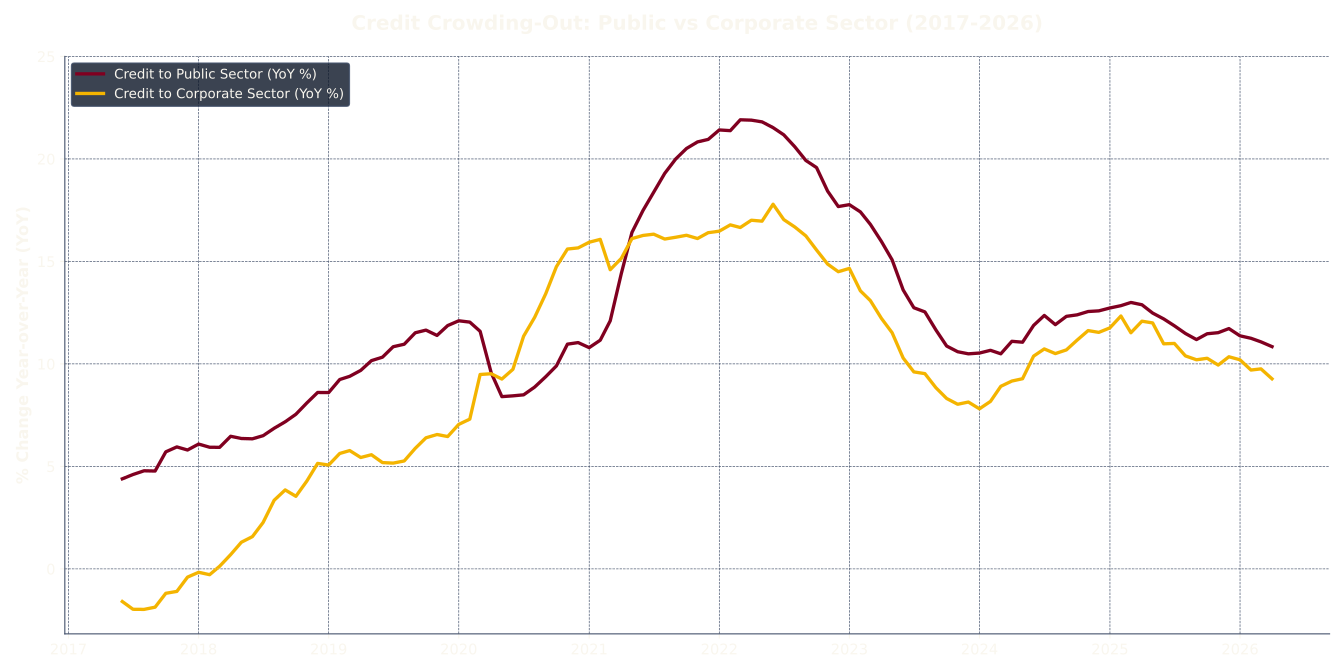
To eliminate balance-sheet risk, banks prefer financing the State rather than the productive sector: public credit accelerates by +8.19% YoY, reaching R$ 292.9 billion, while corporate credit slows to a modest +6.52%. In an environment of such punitive real rates, this nominal +6.52% masks a severe contraction in real terms: companies are not borrowing to invest in capacity, but merely to refinance emergency working capital at usurious bank rates.
Compounding this internal squeeze is the weight of contingent liabilities: R$ 336.81 billion in federal guarantees granted to local states and municipalities for offshore loans. Because 51.1% of these guarantees are denominated in foreign currency (US dollars) while local entities collect taxes in Reais, any devaluation of the Real drives subnational budgets into default. Since 2016, the Federal Government has had to disburse R$ 87.89 billion to honor local defaults, including R$ 1.37 billion in April 2026 alone, converting subnational external liabilities into new domestic debt.
THE HISTORICAL TURNING POINT — External risk eliminated, the domestic trap is born
The expansion of the Gross Debt in recent years—from 51.5% of GDP in 2013 to the current 83.00% in 2026—is the product of a two-stroke engine. The compounding of interest driven by the high Selic rate hits a rigid, chronic structural increase in primary spending (the operational costs of the State).
Historically, the legislative transition allowed the country to bypass the classic "Original Sin" of emerging markets—namely, the inability to borrow abroad in local currency, which exposed budgets to devastating currency mismatches. Through the path paved by the Tripé Macroeconômico (1999) and the Lei de Responsabilidade Fiscal (2000), the Treasury fully nationalized risk by forcing the State to finance itself in Reais. In 2006, the debt with the IMF was paid off, and by 2008 the country became a net foreign creditor. International default risk was zeroed out, as the State cannot default on debt issued in its own currency, but the burden was entirely transferred to the domestic market via punitive real rates to ensure the continuous rollover of bonds.
THE COMMODITY SHIELD — L'illusione del debito netto e la fine della correlazione inversa
The Dívida Líquida (Net Government Debt, DLSP) remains the international solvency shield. As a net creditor, if the Real devalues, International Reserves (over 80% invested in U.S. Treasuries and the remainder in supranational institutions like the BIS and IMF) increase in value when converted into Reais, improving sovereign net accounting.
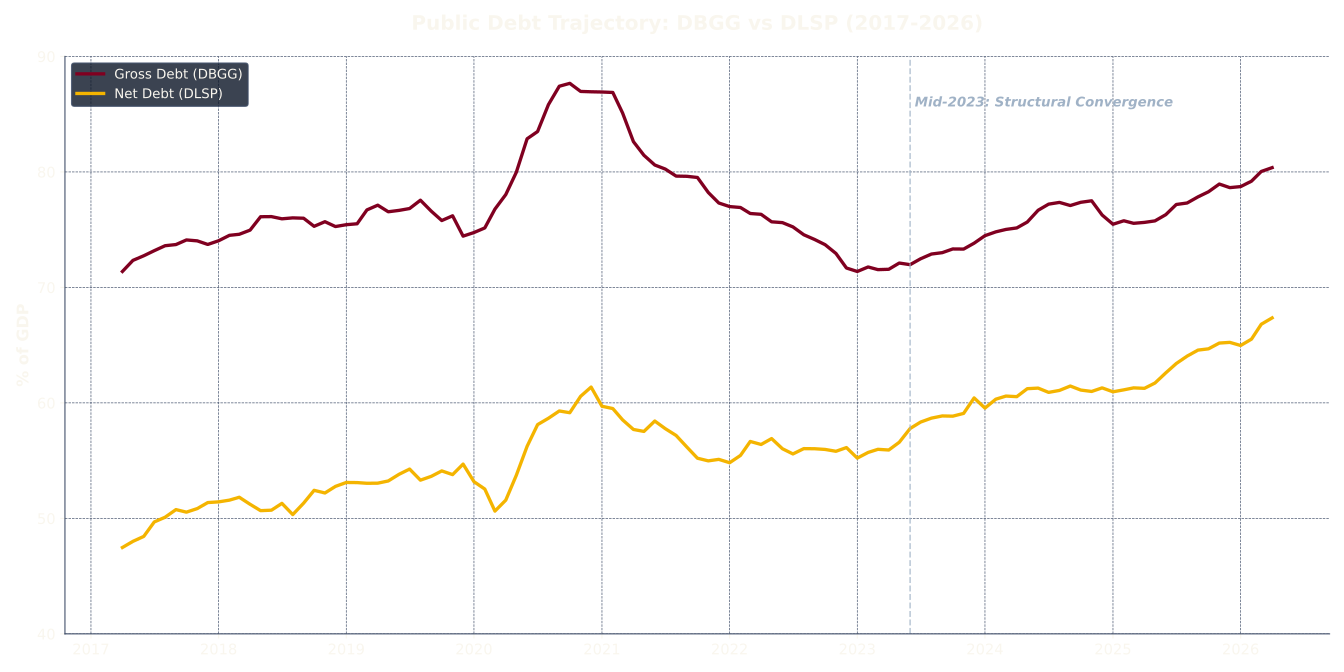
However, historical monthly data from April 2017 to April 2026 exposes the structural end of this protection. Since 2023, the reserve shield has ceased to function: the Net Debt curve has broken its historical inverse correlation and has begun rising in perfect tandem with Gross Debt, pointing toward 68% of GDP.
This macroeconomic breakdown of 2023, visible geometrically in the chart right after the mid-2023 mark, stems from three severe structural dynamics:
The return to a structural primary deficit: The temporary window of primary surpluses seen in previous years closed in 2023. The return to a current deficit acted as a double balance-sheet blow, forcing the Treasury to issue new bonds (inflating DBGG) while simultaneously draining net assets (pushing DLSP higher).
The stranglehold of a 13.75% Selic: To rein in inflationary pressures, the Central Bank was forced to maintain the benchmark rate at 13.75% for most of 2023. This spike triggered an automatic, compounding geometric accrual of interest across the entire floating-rate debt stock.
The boiling point of negative carry (holding costs): Holding approximately $350 billion in international reserves yielding an average of around 4.5% in US Treasuries, while financing them in the domestic market at 13.75% first and 14.50% later, creates a net balance-sheet hemorrhage close to 10 percentage points per year. This daily bleed has completely wiped out the accounting benefit of currency devaluation.
The entire public financial ecosystem therefore relies solely on global commodity leadership, a rigid framework where the world maintains a structural, irreplaceable dependence on Brazil's exports:
Soybeans and Soy Derivatives: Uncontested global leader in production and export volumes, dictating the structural pricing of global vegetable protein and crushing chains.
Crude Oil and Energy Minerals: Top Latin American producer, driven by deepwater pre-salt extraction, playing a vital role in balancing global non-OPEC crude supplies.
Iron Ore and Mineral Concentrates: Top global systemic supplier of high-grade iron ore, driving the baseline for international heavy industry and steelmaking infrastructure.
Beef and Bovine Protein: Absolute global powerhouse in export volume, anchoring meat protein security across major Asian and Middle Eastern markets.
Corn: Second-largest global exporter, a pillar of the global feed supply chain.
Cellulose: Absolute leader in production costs and export volumes for the paper supply chain.
Poultry: Top global exporter, critical for meat protein security in Asia.
Orange Juice: De facto monopoly, controlling over 70% of global trade.
Cotton: Steadily among the top three global exporters, a critical economic input for the Asian textile industry.
Sugar: Largest global exporter, regulating international agro-energy pricing.
Coffee: Top global producer, dictating benchmark pricing across commodity boards.
Pork: Fourth-largest global exporter, expanding rapidly to cover animal protein deficits in Asia.
Bauxite and Aluminum: Among the heavy global suppliers, strategic metals for industrial transition.
Tobacco: Leading global exporter of unmanufactured tobacco leaves, a high-yield cash crop.
The Primary Balance Trend: The Illusion of a Temporary Surplus
The trajectory of the primary balance over the past decade reveals a ruthless pattern: following the chronic deficit cycle initiated in 2014, the brief surplus recorded in the post-pandemic window (2021-2022) did not represent a structural fiscal consolidation, but rather an exogenous anomaly fueled by global inflation and peak commodity revenues. The subsequent geometric relapse into a structural primary deficit starting in 2023—with a median projection settling at R$ 57.8 billion—proves that once international price support evaporates, the intrinsic rigidity of current spending immediately resurfaces. It is the reversal of this trend, more than any other variable, that strips the State of its capacity to absorb debt, transforming the deficit into an automatic multiplier of the Net Debt.
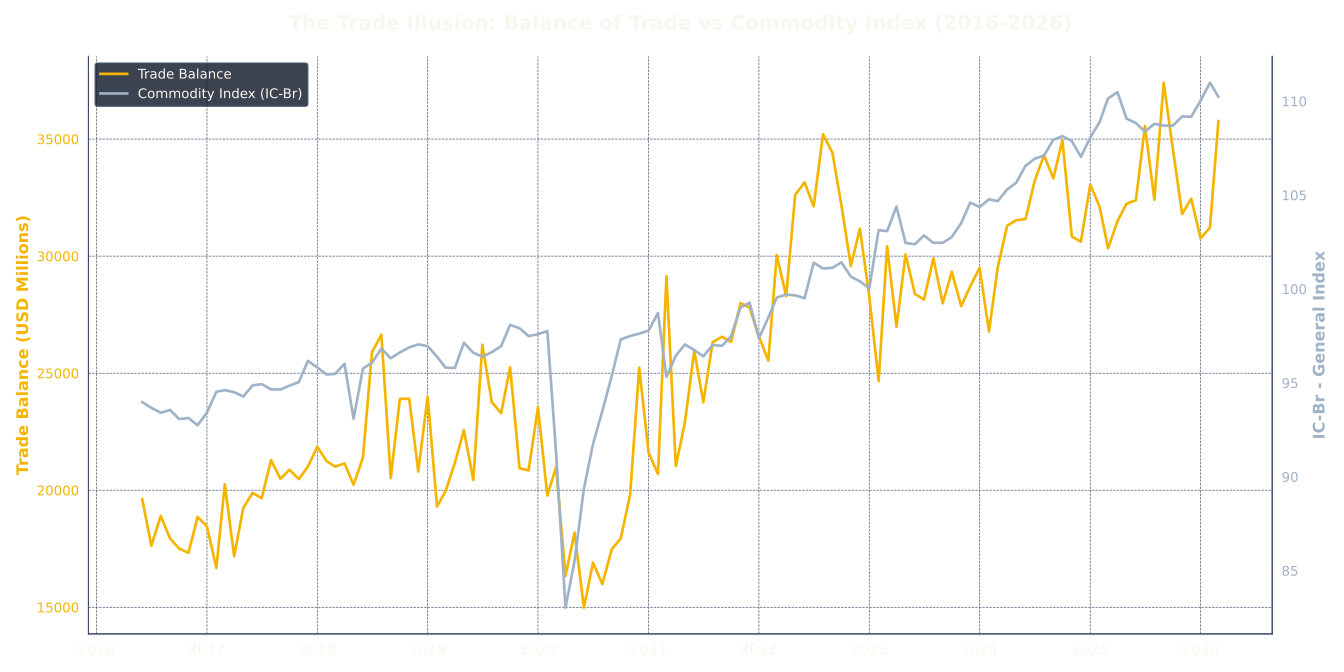
Under normal market conditions, when the trade balance and prices are merely average or low, this "hidden subsidy" from commodities vanishes. Because domestic spending is rigid and the Selic remains high to anchor inflation, the overall debt stock (both gross and net) resumes its automatic upward path through pure compounding of interest.
WHAT LIES AHEAD — Short- and medium-term effects without price booms
The deployment of the current spending model under an average trade balance triggers clear systemic frictions.
In the short term (Crowding-Out Asphyxiation and the Avalanche Effect): The absence of a supercycle windfall immediately exposes budget rigidity. The Treasury is forced to ramp up domestic auction volumes, worsening crowding-out. Banks, able to park liquidity in risk-free sovereign bonds at punitive real rates, curtail corporate lending. Private enterprises face a negative credit impulse and a working capital squeeze, accelerating default rates (inadimplência). Simultaneously, the avalanche effect on borrowing costs triggers: since 47.7% of the debt is tied to floating-rate LFT bonds, any monetary tightening to anchor inflation instantly expands the interest burden for the State itself.
In the medium term (The Zero-Growth Trap and Structural Friction): Over a 2-to-5-year horizon, the system slides into economic emaciation. A cost of capital structurally higher than industrial project ROI eliminates private Capex, depressing potential GDP and making Gross Debt structurally ascending. Mandatory outlays and debt service cannibalize public infrastructure investments, undermining competitiveness.
The system arrives at an unavoidable crossroads: the government must either implement politically complex structural cuts (to mandatory outlays and administrative frameworks) or it will be forced down the path of deficit monetization and inflationary taxation.
Nationalizing debt protected the country from external balance-of-payments crises, but in the absence of extraordinary commodity booms, the domestic economy is structurally sacrificed to feed the rollover of public bonds, transforming the system into a high-yield rentier market at the expense of the productive apparatus.